What Is a Competitive Advantage and Do I Have One?

The value of a business depends on its ability to generate and sustain returns on invested capital (“ROIC”) and the capacity of the business to grow over time. Therefore, understanding and predicting what drives and sustains ROIC is critical to evaluating investments and business strategies. The ROIC of any company or industry can be explained by its competitive advantage (or lack thereof). But what exactly drives a company’s ROIC, and how can managers measure and manage it over time?

If a company earns a high ROIC, it either charges a price premium or produces/distributes its products more cost effectively than its competitors. To analyze the potential sources of competitive advantage, we can disaggregate the equation for ROIC to determine whether a company’s ROIC is driven by its ability to maximize profitability or optimize capital turnover.

Exhibit A: Return on Invested Capital Tree

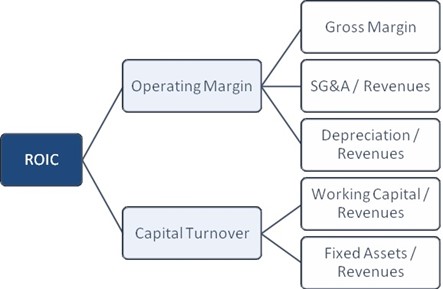
Exhibit A shows how the components can be organized into a tree; each of these components can be further disaggregated to enable a line item by line item analysis of a company’s ROIC. After determining the drivers of a company’s ROIC, we can combine this with an analysis of industry structure and a qualitative assessment of the company’s strengths and weaknesses to determine its competitive advantage over its competitors.

It is important to remember that industry dynamics is a chief driver of competitive behavior, and therefore greatly influences the performance and returns of its constituents. ROIC varies greatly among industries due to differences in inherent industry characteristics, which highlights the importance of benchmarking companies against competitors. Exhibit B below compares the returns on capital and operating margin of select industries, with the size of the bubble indicating the number of constituents in each industry.

Exhibit B: Industry Structure Comparison

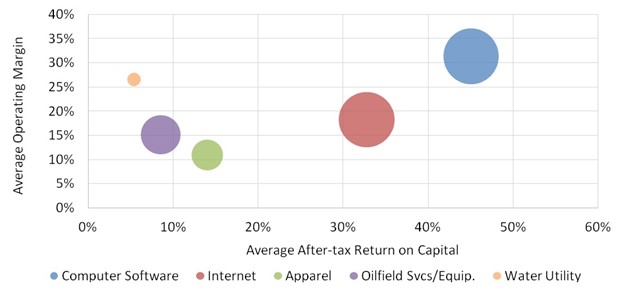
Source: NYU Stern School of Business

Though the performance of companies in all industries will vary with the business cycle, companies in commoditized industries will rarely reach the levels of those industries with more defensible structures. The Internet & Software industries, for example, often offer innovative products that are either protected by intellectual property rights, generate recurring revenue through subscription based services, and/or involve high switching costs for customers. These competitive advantages create a moat around these companies protecting them from competitors.

In the Apparel industry and other consumer products industries, certain companies have developed long-lasting brands that have customer loyalty and make it difficult for new competitors to compete. By contrast, more commoditized industries such as Oilfield Equipment and Services, or the Water Utility industry at the far end of the spectrum, offer undifferentiated products and services which prevent constituents from building a sustainable competitive advantage.

In summary, there are a lot of factors that affect a company’s ability to create and sustain a competitive advantage. Investors tend to reward companies generating outsized returns versus competitors with higher valuations. While we can measure a company’s ROIC and its various components, a company’s performance always needs to be viewed through the lens of its industry structure and combined with a qualitative analysis of competitive position.

Not All Revenue Is Valued Equally

Most companies are valued by applying a multiple to the businesses EBITDA (earnings before interest taxes, depreciation, and amortization). However, buyers will closely examine the revenue streams generating that EBITDA and assess the quality thereof. Here are a few things buyers will look for when assessing a company’s revenue streams.

1. Revenue Consistency

The more stable and predictable the revenue stream and the profit therefrom, the more the buyer will be willing to pay. This provides forward visibility and mitigates risk, because the revenue can be counted on in the future with a high degree of certainty. Most subscription models would fall into this category. Assuming customer churn is low, and the lifetime value of the customer outweighs the customer acquisition costs, buyers will pay up for this type of business model. On the flip side, earnings generated from project based work or one-time events will typically be heavily discounted.

2. Customer Diversity

One strong customer can get a business up and going, but diversity is required to mitigate risk. This also applies to customer concentration within revenue streams. If the revenue stream would suffer meaningfully due to the loss of one or two customers, buyers will take this into account. Customer concentration will not only lower the value of a company but might scare off buyers altogether.

3. Margins

Buyers will pay great attention to a company’s margins and assess the overall business by comparing margins to like companies. Superior margins oftentimes mean a competitive advantage, which gives a buyer greater comfort that the revenue and profit therefrom is protected.  In addition to looking at a company’s overall margins, buyers will assess the margin contributed by each revenue stream.  Growth in revenue streams with higher margins will be rewarded, while revenue with lower margins, even if growing, will often be discounted.

Conclusion

These are important factors to consider when operating and growing your business. Yet, every company and industry is different and not every business model can have the recurring revenue and customer diversification of Netflix. If you want to know how you measure up in these areas, benchmark yourself against competitors or companies with a business model similar to your own. Taking action to improve and be the best among your peers in these areas will not only increase the value of your company, it will mitigate the risk you have as an owner.

Vibrant Mergers & Acquisitions Market Continues to Surge – June 2021

Optimism abounds in the 2021 M&A market, priming it for high activity. Companies, across all industries, are looking to grow as a result of increasing competition, record amounts of cash sitting on corporate balance sheets, and low interest rates. The demand for high-quality businesses is strong, and there has never been a better time to enter the market.


As the North American economy continued to rebound in Q1, so too did M&A activity with over 5,388 deals closing in the quarter. This was a 26% growth from Q1 2020. Additionally, there were 11,394 deals recorded globally in Q1.

The above chart represents M&A activity by value Q1 2020 – Q1 2021 for North America. The upward trend in volume is a direct reflection of the current, positive market conditions. The expectation is for this upward trend to continue throughout 2021.

In Q1 alone there were over 5,621 deals announced targeting companies in the U.S. and Canada. This was the second highest first quarter total this century. Currently, the North American M&A market makes up 53% of the world M&A market.

The Industrials sector undertook the most deals in 2021 with 939 deals. While the technology, media, and telecom industry led the way in terms of valuation at $204bn. With low interest rates and potential tax changes, pent up demand for acquisitions is surging this year.

Sources: S&P Global,  White & Case, Pitchbook